CHILL

CHILL implementation for various social services in Belgium

Deployment, hosting and maintenance of the chill application with all its general features as explained here, https://www.chill.social.

Support for configuration and training for administrators.

Customers:

  • HepC: a healthcare network bringing together a maximum number of key players in the management of hepatitis C among vulnerable groups in Brussels.
  • Chronicopôle: support for people with chronic illnesses.
  • Douche Flux: a social and participative project that seeks to improve care for people in very precarious situations.
  • Cyclo: a social economy enterprise focused on job development and improving the urban environment.
  • Interstice: non-profit organization offering school-related and extra-curricular activities for children in the Vieux Laeken Est neighborhood.
  • Resinam: non-profit organization whose main function is to test the implementation of innovative integrated health initiatives.
  • Resad: support network for addiction problems.
  • Rixensart: a municipality.
  • Halle de Han: socio-professional integration center offering training in sales-accommodation-logistics, vocational guidance and the services of a graphics studio.
AMLI

Implementation of CHILL for a social housing agency

The development of an application for client follow-up by the social workers of a social housing agency. The application builds upon the base software Chill.

Functional analysis of needs, design and implementation of database, adaptation of Chill and supplementary developments.

Deployment and maintenance of the solution. Initial training of IT personnel in charge of the future maintenance of the application within the agency.

Further training of all social workers using the application on a daily basis.

[Read More]

Département de la Vendée

Implementation of CHILL for the social services of the Département de la Vendée

The development of an application for client follow-up by social workers of different social services within the French department of the Vendée.

Functional analysis of needs, design and implementation of database, further developments of the base application Chill.

Deployment and maintenance of the solution. Training of all social workers using the application on a daily basis.

A.T.L.A.S

webGIS application

For the realization of this project we used the Cartostation framework developed by Atelier Cartographique, a Brussels-based cooperative with which we regularly collaborate.

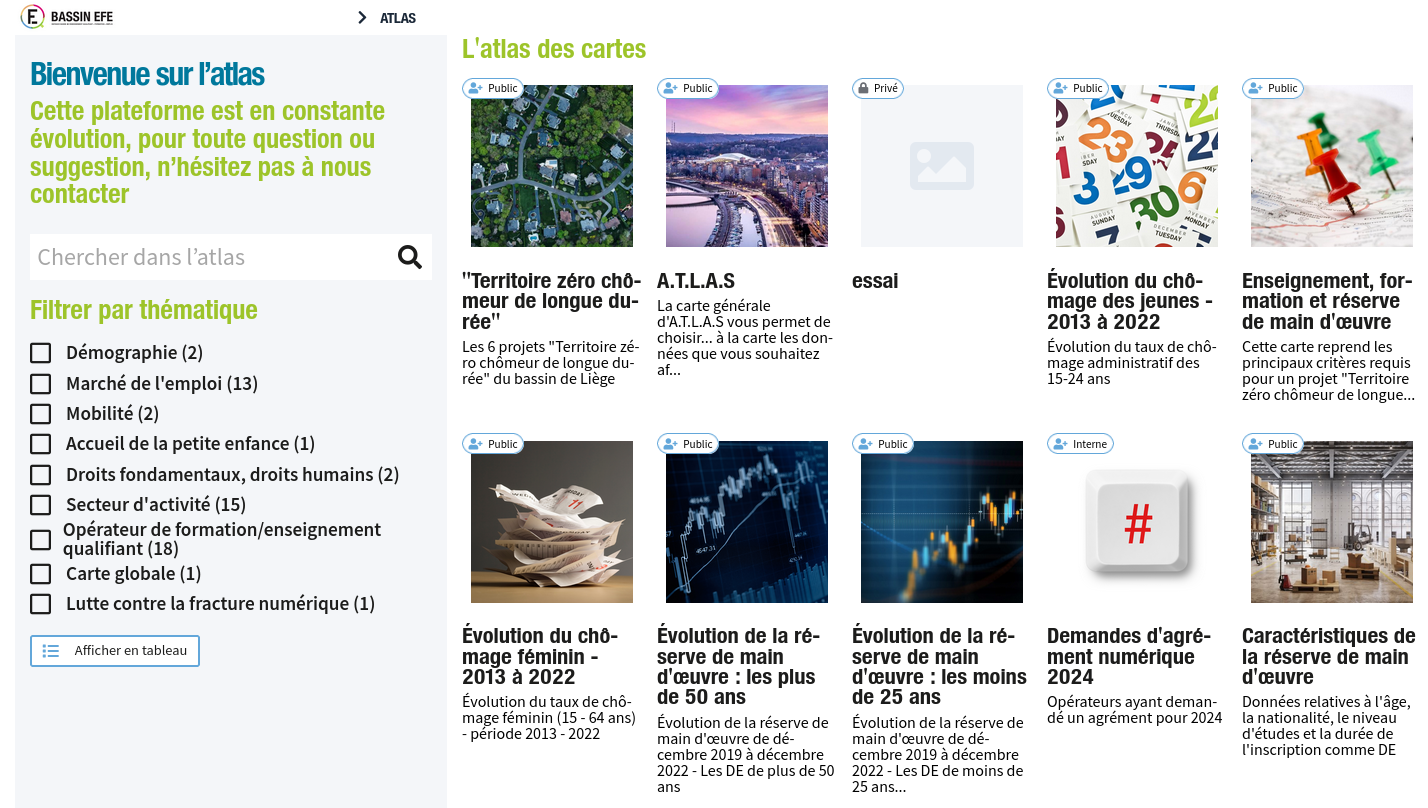
A.T.L.A.S. makes it possible to visualize some of the data from IBEFE’s triennial Analytical and Prospective Report, to embody figures and rates in the territory and to cross-reference different information, thus offering a tool for reflection, orientation, analysis and prospective.

Natagriwal

Geomatic support

Geomatic support for Natagriwal.

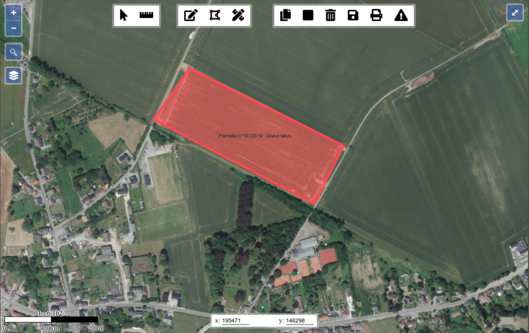
Natagriwal produces expert reports to support the development of agri-environmental measures for farmers. We support their activity by managing their spatial database and by developing cartographic clients to interact with their spatial data.

In a first phase, we set up a PostgreSQL/PostGIS database with a QGIS client. In a second phase, we developed in Javascript a dedicated cartographic application that integrates with the expert reports redaction application (in PHP). Compared to the use of a classical GIS software, the cartographic application allowed to simplify the writing of expert reports for Natagriwal’s officers.

[Read More]

Egeriec

WebGIS application for the identification and diagnostic of water pollution.

Development of a digital tool for the diagnostic and risk management specific to certain water catchment zones. A first part of the webGIS application allows users to consult data and statistics related to different water catchment zones. Following this a methodological tool offers users the possiblility to identify different solutions based on their efficiency in protecting a water catchment zone.

The application is part of a bigger research project conducted by the Catholic University of Leuven.

[Read More]

Comedien.be

Réseau social professionnel pour les arts de la scène

Développement de l’application web Comedien.be. Analyse fonctionnelle du besoin en relation avec les demandes du client.

Design de la base de données et implémentation en postgreSQL. Migration des données présentes dans l’ancienne application vers la nouvelle implémentation. Développement de l’application.

Stockage d’un grand volume de fichiers avec une solution basée sur OpenStack/Swift.

Déploiement et maintenance de l’application.

Infrastructure informatique

Infrastructure informatique

Infrastructure pour les projets de développement

Champs-Libres gère sa propre infrastructure informatique de cloud.

Cette infrastructure lui permet d’héberger les projets de ses clients. Elle a été construite pour permettre le déploiement des projets de manière fréquente, de manière à réduire le cycle développement - mise en production.

Quelques caractéristiques ;

  • l’infrastructure est basée sur docker swarm (Kubernetes en développement) ;
  • elle est répartie sur 8 serveurs virtuels ;
  • elle héberge 15 projets différents, et 20 stacks docker swarm ;
  • certains projets servent deux millions de pages par jour (comedien.be). Le temps de réponse des projets les plus consommateurs de ressources sont inférieurs à 500ms pour 75% des pages ;
  • l’infrastructure collecte en permanence des métriques sur son systèmes (openTSDB), visualisables via Grafana. Elle permet également la centralisation, le tri et le stockage des logs ;
  • le SLA sur les projets hébergés est de 99.9% ;
  • l’infrastructure logicielle est basée sur des conteneurs. Des serveurs spécifiques viennent s’ajouter à ceux-ci et proposent des services persistants: PostgreSQL en réplication, cluster RabbitMQ, …

Notre infrastructure nous permet de déployer des projets de différentes technologies. Citons notamment :

[Read More]

Cyclabilité

Application participative pour définir la cyclabilité de voiries

Développement d’un outil de « cyclabilité », qui permet aux cyclistes d’une région de voter pour définir le degré de « cyclabilité » des routes ou portions de route de ce territoire.

Le graphe routier est extrait d’OpenStreetMap. L’import du graphe routier et le découpage des routes se fait à l’aide de PostGIS.

Formations à l’installation de l’outil.