A.T.L.A.S

webGIS application

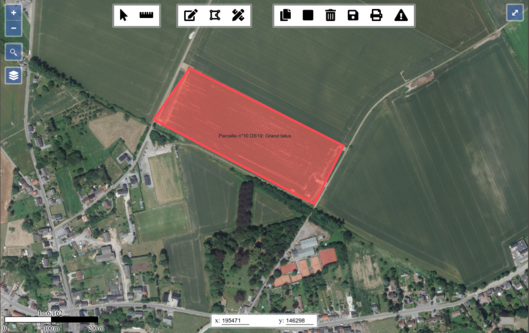
For the realization of this project we used the Cartostation framework developed by Atelier Cartographique, a Brussels-based cooperative with which we regularly collaborate.

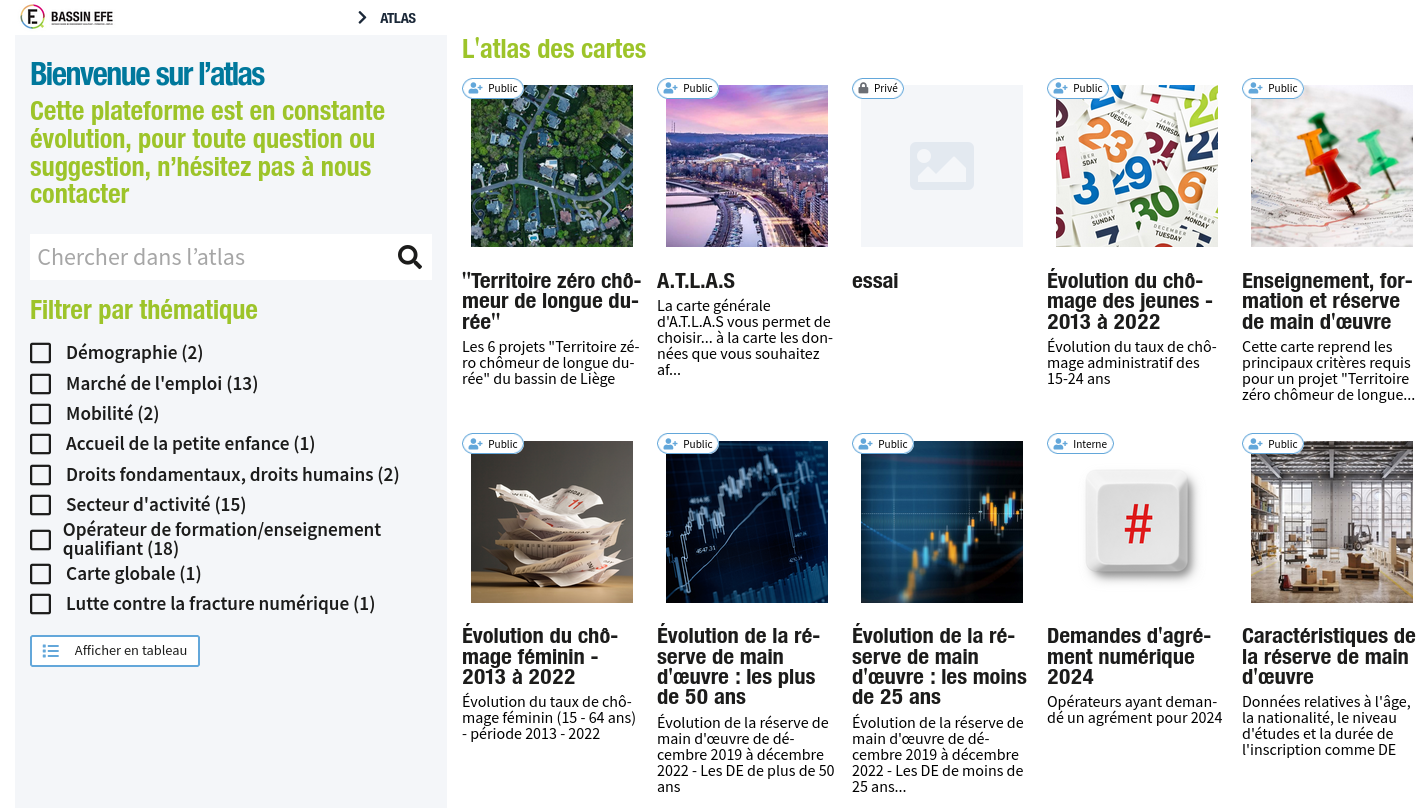
A.T.L.A.S. makes it possible to visualize some of the data from IBEFE’s triennial Analytical and Prospective Report, to embody figures and rates in the territory and to cross-reference different information, thus offering a tool for reflection, orientation, analysis and prospective.

Egeriec

WebGIS application for the identification and diagnostic of water pollution.

Development of a digital tool for the diagnostic and risk management specific to certain water catchment zones. A first part of the webGIS application allows users to consult data and statistics related to different water catchment zones. Following this a methodological tool offers users the possiblility to identify different solutions based on their efficiency in protecting a water catchment zone.

The application is part of a bigger research project conducted by the Catholic University of Leuven.

[Read More]

Perspective

Plateforme de Veille des Plans et Projets Urbains

Mise en place d’un système d’information spatial et temporel, transversal et commun à l’ensemble des services de l’administration Perspective.brussels, en charge de l’urbanisme de la région Bruxelles Capitale.

Une analyse fonctionnelle poussée a précédée le design de la base de données, tandis que des ateliers avec les différents opérateurs ont permis de faire converger une partie de la structure informationelle, tout en conservant les spécificités des différents métiers.

Les différents besoins sont adressés par le développement d’applicatifs dédiés, sur une plateforme commune et open-source.

[Read More]

Geothermal portal

Mapping portal of the geothermal potential for Brussels region

Development of a mapping portal of the geothermal potential for Brussels region. Realised for Bruxelles-Environnement, in partnership with APERe (BE) and Atelier Cartographique (BE).

The mission consisted of presenting geological data via an original cartographic interface, combining a classical slippy map to a 3D viewer. At each point of the region at a resolution of 10m, a precise geological profile is automatically extracted when you click on the map. This application is intended for the informed general public and geothermal energy professionals in the Brussels Region. The application is integrated into the Brussels-Environment open source mapping platform.

[Read More]

Carto solaire

Cadastre du potentiel solaire de la Région Bruxelles-Capitale

Réalisation du cadastre solaire de la région Bruxelles Capitale pour Bruxelles Environnement, en partenariat avec l’APERe (BE), Atelier Cartographique (BE) et MeteoTest (CH).

La mission consiste à évaluer le potentiel d’énergie solaire des toitures des bâtiments de la région, sur base des données Urbis3D et de données météo. Une interface publique de consultation et un calculateur de rendement permet de visualiser le potentiel d’énergie solaire par bâtiment.